

CellWhere
User Guide and FAQs
Jump to...
What is CellWhere?
What is CellWhere for?
How can I use CellWhere for my research?
How does CellWhere localize proteins?
How does CellWhere know where to place sub-locations on the cell diagram?
What are CellWhere's default localizations?
Advanced options: what if a protein localizes to multiple locations?
How does CellWhere produce it's graphical display?
What features does the graph have?
How can I find out about the evidence for an interaction?
Advanced options: what are promiscuous interactors?
How do I share the output?
Why is my favorite protein at a weird location?
What are the different download files and how can I use them?
Is there a CellWhere API? Can I connect with CellWhere programmatically?
CellWhere is a data combining and visualization tool that enables bench researchers to quickly explore the reported subcellular locations of a list of genes/proteins, and to put these subcellular locations into the context of previously identified physical interactions that could be occurring between these proteins and others within the cell.
CellWhere retrieves localizations from UniProt and/or The Gene Ontology, and retrieves interactions from the Mentha server. It graphs the resulting network to resemble a physical map of the cell, placing proteins in a way that helps biologists to hypothesize and interpret mechanistic links between their genes/proteins of interest. It produces an interactive display of the graph using the Cytoscape.js library.
A researcher can begin with one or more genes/proteins of special interest to her, or may have a longer list resulting from some screening or omics analysis. In either case:
and, if the researcher has used some other process to arrive at a gene association network in Cytoscape 3 (such as IntAct or GeneMANIA results):
Below are a few ways that you can benefit from CellWhere (there are almost certainly other uses that we have not thought of!)
The table below shows the localization procedure for 3 example queries:
For the three query genes, reviewed Swiss-Prot (UniProt) protein accessions were retrieved (in this example, gene names are queried, but other identifiers can also be used), along with localization terms from The Gene Ontology and UniProt (actually, CellWhere retrives the localization text field from UniProt and parses it into phrases). These terms (of which ~3000 are in use) are then mapped to CellWhere localizations (of which there are 50 - see "What are CellWhere's default localizations?"). The relative frequency of each CellWhere localization is calculated for a given protein.
CellWhere currently maps all Uniprot and GO localization terms that have been applied to more than 25 proteins. This covers more than 99% of all protein localization annotations (1,258,337 out of a total of 1,269,645), and includes the most frequently used 1013 of the 3812 terms that comprise the Gene Ontology Cellular Component namespace, and 422 of the 1283 terms parsed from the Uniprot Subcellular location field.
If you select "Generic" as the localization flavor then it is the frequency percentage that is used to select the localization at which the protein will be shown on the final graph. In this case, RRAD, EMILIN2, and ACTC1, would be placed at the Membrane, ECM, and Cytoplasm, respectively.
Alternatively, a ranked list of all the CellWhere localizations is consulted and the highest ranking for a given protein is chosen for that proteins location on the graph. We include several ranked list 'flavors', and by using one as a template you can create your own flavor according to your research interests (please see the front page for template and upload instructions, and also the downloadable files available from the menu). By using our muscle flavor, in the example above ACTC1 would be placed into the 'Focal adhesion' location, because the muscle flavor sets a high priority score on this location, due to it being of special interest to muscle researchers.
You are not obliged to use both the UniProt and GO localizations, and can choose either alone. The UniProt localization field is carefully (and conservatively) curated to contain the classicly known locations of a protein, whereas The Gene Ontology is aimed more towards a comprehensive listing of all locations at which a protein has been observed. Therefore, in our context, GO is useful for screening proteins against localizations of interest, whereas UniProt is useful if you are interested to know the 'typical' location of a protein.
The "spatial relation" tells CellWhere how to place a localization on the output graph. CellWhere currently supports the following spatial relations. Each CellWhere localization must be associated with one of these in the mapping file.
* "Nucleus", "Cytoplasm", "Membrane", and "Extracellular", are the primary compartments of CellWhere's visual display. A localization that is designated to one of these will not be independently labeled. Instead, proteins carrying this localization will float freely within the primary compartment - the localization will NOT be given a separate box (these boxes are referred to in Cytoscape.js as 'compound nodes').
† A location designated as "IN Nucleus", "IN Cytoplasm", "IN Membrane", or "IN Extracellular", will be given it's own box, and member proteins will be displayed within this box. The box will be located somewhere within the appropriate primary compartment (Nucleus, Cytoplasm, Membrane, or Extracellular).
‡ A location designated as "UNDER Membrane", "SURFACE Membrane", or ""ACROSS MEMBRANE", will be given it's own box. The box will be placed, respectively: touching the interior of the cell membrane, touching the exterior of the cell membrane, or traversing entirely the membrane.
When you localize proteins by annotation frequency, CellWhere uses its generic mapping file. This file maps Uniprot and GO localization terms to one or more of the 50 CellWhere localization terms shown in the following table. As described above, you can download an example mapping file by following the link on the front page, and you can create your own mappings by creating and uploading a pre-made flavor.
Many proteins have been experimentally observed at more than one location and carry mutliple localization annotations in Uniprot and/or GO. Examples include proteins that shuttle between organelles, that perform different functions at different points in development or cell differentiation, or that behave differently depending on cell type.
Cellwhere now includes an advanced feature to display duplicate copies of a protein node at alternative locations. The feature can be observed by running the default query but selecting “Annotation frequency” under localization options. Duplicate nodes are connected to their parent node by a green edge labelled with a question mark.
This feature is switched on by default when using "annotation frequency" but off by default when using priority flavors. It can be modified under advanced options at the bottom of the front page. By default, when the feature is selected, an alternative location will be shown if it has a frequency score >0.33 (i.e. if >33% of the protein's Uniprot/GO annotations map to this CellWhere localization). The user can set this cut-off value as desired, but low values will be refused if they result in a too large and over-populated graph. If using the feature with a priority flavor rather than annotation frequency, the score should be adjusted accordingly (e.g. to 7000 or some other high value).
The localization step described above is used to visually organize the graph, as indicated in the two schema to the right below
CellWhere first attributes subcellular locations, as described above, for either the uploaded gene list or an uploaded pre-made network.
CellWhere will also query the Mentha server to retrieve known interactions between query proteins, together with the score allocated by Mentha as a measure of the strength of the evidence supporting each interaction.
If the option to grow the network using Mentha is selected, then CellWhere will request additional interactors of the query proteins. It will rank these by their score and retain all of the interacting proteins up to the maximum number set by the user.
The resulting network, with subcellular locations added is then organized for visualization.
Proteins are grouped according to their location, and locations are organized graphically.
A limited vocabulary (as described above) specified in the mapping file tells CellWhere where to place each location relative to the cell and to the cell membrane (for example, the Gap Junction may be marked 'ACROSS Membrane', or the Peroxisome marked 'IN Cytoplasm').
Co-ordinates are recalculated and the network is displayed using Cytoscape.js, on top of a membrane background.
(this is also summarised in the 'GRAPH GUIDE' panel on the right side of the output page)
As explained above, left-clicking on an interaction (an 'edge') pops up a box giving the evidence score and listing interaction evidence from Mentha. Edges with strong evidence scores have thicker widths. Evidence scores range from 0.03 (weakest) to 1 (strongest), and average around 0.25. Only ~10% of scores are stronger than 0.5. Details of the Mentha scoring function are given here.
The example table below shows the evidence for the interaction between Dystrophin (DMD gene) and Dystroglycan (DAG1 gene).
Mentha has provided four pieces of evidence for this interaction, two by crystallography, one by affinity chromatography and the other using pull down. A link is provided to the PubMed entry of the work in which the experiment was performed, and the source database is shown from which Mentha obtained the interaction evidence, together with the DOI of the supporting publication.
Certain proteins (for example, Ubiquitins and heat shock proteins) form a great many interactions due to general functions that are unlikely to be pertinent to a specific mechanistic pathway. CellWhere provides a feature to ignore 'promiscuous interactors' during the addition of binding partners from Mentha. CellWhere pre-processes the Mentha data, making interaction counts for every protein, and storing these in the CellWhere database. The default behavior is to ignore proteins that bind more than 100 partners. Mentha currently reports interactions for ~82,000 proteins, and ~1,300 (~1.5%) of these have more than 100 reported binding partners. The user may adjust the cut-off as desired – it is available under “advanced options” at the bottom of the front page.
Various sharing options are given in the 'SAVE AS...' panel on the right side of the output page
The output can be saved simply as html (if you want to email it, then we recommended to use the 'zipped' option as this will avoid problems with some email applications that will otherwise try to read the attached html)
The network can also be downloaded in Cytoscape 3's xgmml format, for example if you wish to manipulate the network using the Cytoscape 3 desktop application. Please note however that the localization groupings (known as 'compound nodes' in Cytoscape.js) cannot currently be displayed by Cytoscape 3.
Please see "Why is CellWhere wrong?".
Yes! Please see "Developer guide for CellWhere".
What is CellWhere?
What is CellWhere for?
How can I use CellWhere for my research?
How does CellWhere localize proteins?
How does CellWhere know where to place sub-locations on the cell diagram?
What are CellWhere's default localizations?
Advanced options: what if a protein localizes to multiple locations?
How does CellWhere produce it's graphical display?
What features does the graph have?
How can I find out about the evidence for an interaction?
Advanced options: what are promiscuous interactors?
How do I share the output?
Why is my favorite protein at a weird location?
What are the different download files and how can I use them?
Is there a CellWhere API? Can I connect with CellWhere programmatically?
What is CellWhere?
CellWhere is a data combining and visualization tool that enables bench researchers to quickly explore the reported subcellular locations of a list of genes/proteins, and to put these subcellular locations into the context of previously identified physical interactions that could be occurring between these proteins and others within the cell.
CellWhere retrieves localizations from UniProt and/or The Gene Ontology, and retrieves interactions from the Mentha server. It graphs the resulting network to resemble a physical map of the cell, placing proteins in a way that helps biologists to hypothesize and interpret mechanistic links between their genes/proteins of interest. It produces an interactive display of the graph using the Cytoscape.js library.
What is CellWhere for?
A researcher can begin with one or more genes/proteins of special interest to her, or may have a longer list resulting from some screening or omics analysis. In either case:
1. CellWhere can show where proteins are typically
described to locate in the cell, and what their most strongly evidenced interactions are. This may
suggest mechanistic pathways.
2. CellWhere can show whether proteins and their interactors could be at locations
that the researcher has defined
as being of special interest to her.
and, if the researcher has used some other process to arrive at a gene association network in Cytoscape 3 (such as IntAct or GeneMANIA results):
3. CellWhere can add subcellular locations to a pre-made network and color nodes according a selected
attribute of that pre-made network (such as fold-changes from an omics study).
How can I use CellWhere for my research?
Below are a few ways that you can benefit from CellWhere (there are almost certainly other uses that we have not thought of!)
Communication
1. To share the network graph with collaborators, to help discuss and interpret new findings
2. To produce visual displays that can be added to publications to help explain/discuss new findings
Exploration and interpretation
3. You can use the visual display to imagine mechanistic hypotheses based on interactions and/or localizations, for either:
- a gene short-list derived from omics analysis
- a few genes or proteins of special interest to your project
Basic information retrieval
4. Visualize where proteins are usually reported to locate in the cell
5. Determine if your proteins of interest have been observed at localizations of special interest to you
6. For each protein, quickly obtain a complete list of reported localization terms from The Gene Ontology and Uniprot
7. Visualize how proteins could be interacting with each other, and how this relates to the prioritized localizations
8. Visualize the wider network of strongly supported interactions of your query proteins
How does CellWhere localize proteins?
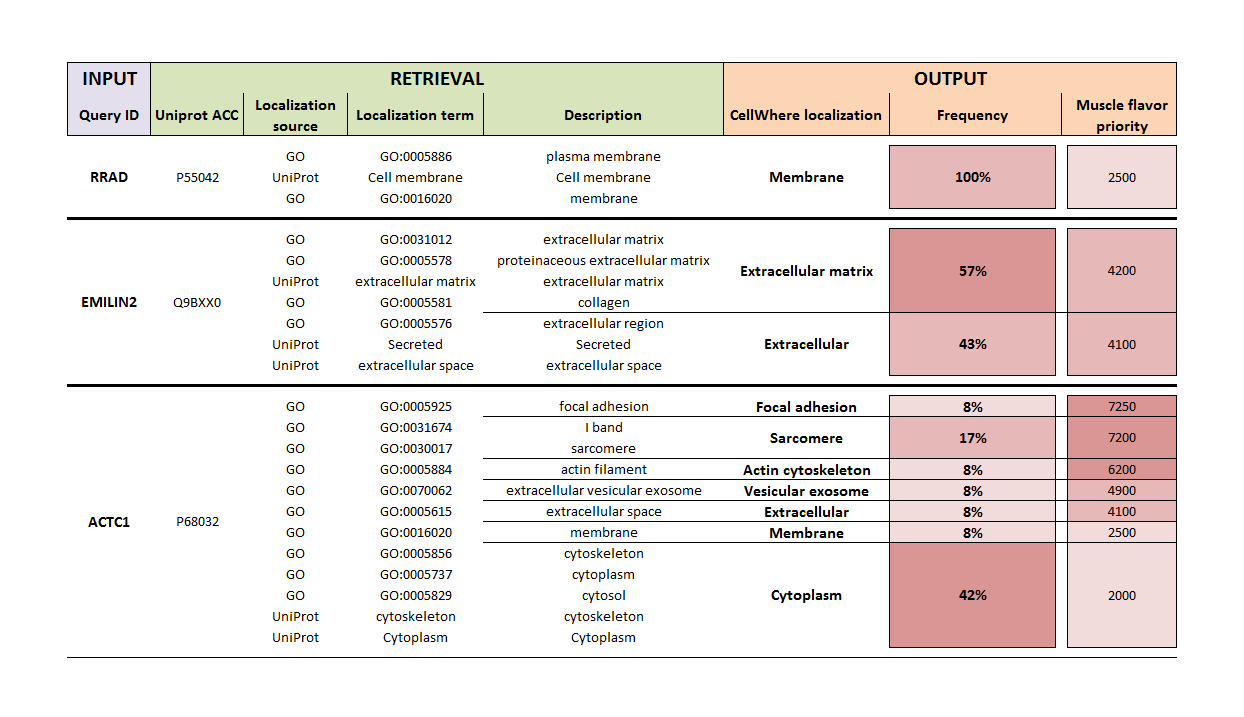
The table below shows the localization procedure for 3 example queries:
[MOUSE-OVER THE TABLE TO ZOOM]
For the three query genes, reviewed Swiss-Prot (UniProt) protein accessions were retrieved (in this example, gene names are queried, but other identifiers can also be used), along with localization terms from The Gene Ontology and UniProt (actually, CellWhere retrives the localization text field from UniProt and parses it into phrases). These terms (of which ~3000 are in use) are then mapped to CellWhere localizations (of which there are 50 - see "What are CellWhere's default localizations?"). The relative frequency of each CellWhere localization is calculated for a given protein.
CellWhere currently maps all Uniprot and GO localization terms that have been applied to more than 25 proteins. This covers more than 99% of all protein localization annotations (1,258,337 out of a total of 1,269,645), and includes the most frequently used 1013 of the 3812 terms that comprise the Gene Ontology Cellular Component namespace, and 422 of the 1283 terms parsed from the Uniprot Subcellular location field.
If you select "Generic" as the localization flavor then it is the frequency percentage that is used to select the localization at which the protein will be shown on the final graph. In this case, RRAD, EMILIN2, and ACTC1, would be placed at the Membrane, ECM, and Cytoplasm, respectively.
Alternatively, a ranked list of all the CellWhere localizations is consulted and the highest ranking for a given protein is chosen for that proteins location on the graph. We include several ranked list 'flavors', and by using one as a template you can create your own flavor according to your research interests (please see the front page for template and upload instructions, and also the downloadable files available from the menu). By using our muscle flavor, in the example above ACTC1 would be placed into the 'Focal adhesion' location, because the muscle flavor sets a high priority score on this location, due to it being of special interest to muscle researchers.
You are not obliged to use both the UniProt and GO localizations, and can choose either alone. The UniProt localization field is carefully (and conservatively) curated to contain the classicly known locations of a protein, whereas The Gene Ontology is aimed more towards a comprehensive listing of all locations at which a protein has been observed. Therefore, in our context, GO is useful for screening proteins against localizations of interest, whereas UniProt is useful if you are interested to know the 'typical' location of a protein.
How does CellWhere know where to place sub-locations on the cell diagram?
The "spatial relation" tells CellWhere how to place a localization on the output graph. CellWhere currently supports the following spatial relations. Each CellWhere localization must be associated with one of these in the mapping file.
Spatial relation vocabulary:
- Nucleus*
- IN Nucleus†
- Cytoplasm*
- IN Cytoplasm†
- Membrane*
- IN Membrane†
- UNDER Membrane‡
- ACROSS Membrane‡
- SURFACE Membrane‡
- Extracellular*
- IN Extracellular†
* "Nucleus", "Cytoplasm", "Membrane", and "Extracellular", are the primary compartments of CellWhere's visual display. A localization that is designated to one of these will not be independently labeled. Instead, proteins carrying this localization will float freely within the primary compartment - the localization will NOT be given a separate box (these boxes are referred to in Cytoscape.js as 'compound nodes').
† A location designated as "IN Nucleus", "IN Cytoplasm", "IN Membrane", or "IN Extracellular", will be given it's own box, and member proteins will be displayed within this box. The box will be located somewhere within the appropriate primary compartment (Nucleus, Cytoplasm, Membrane, or Extracellular).
‡ A location designated as "UNDER Membrane", "SURFACE Membrane", or ""ACROSS MEMBRANE", will be given it's own box. The box will be placed, respectively: touching the interior of the cell membrane, touching the exterior of the cell membrane, or traversing entirely the membrane.
What are CellWhere's default localizations?
When you localize proteins by annotation frequency, CellWhere uses its generic mapping file. This file maps Uniprot and GO localization terms to one or more of the 50 CellWhere localization terms shown in the following table. As described above, you can download an example mapping file by following the link on the front page, and you can create your own mappings by creating and uploading a pre-made flavor.
| CellWhere localization | Spatial relation | CellWhere localization | Spatial relation |
|---|---|---|---|
| 1. Acrosome | UNDER Membrane | 26. Lysosome | IN Cytoplasm |
| 2. Actin cytoskeleton | IN Cytoplasm | 27. Melanosome | IN Cytoplasm |
| 3. Amyloplast | IN Cytoplasm | 28. Membrane | Membrane |
| 4. Apoplast | SURFACE Membrane | 29. Microtubule cytoskeleton | IN Cytoplasm |
| 5. Autophagosome | IN Cytoplasm | 30. Mitochondrion | IN Cytoplasm |
| 6. Caveolae | UNDER Membrane | 31. Motile parts | ACROSS Membrane |
| 7. Cell cortex | UNDER Membrane | 32. Nucleoid | IN Cytoplasm |
| 8. Cell junction | ACROSS Membrane | 33. Nucleolus | IN Nucleus |
| 9. Cell surface | SURFACE Membrane | 34. Nucleus | Nucleus |
| 10. Cell wall | SURFACE Membrane | 35. Outer membrane | IN Membrane |
| 11. Chloroplast | IN Cytoplasm | 36. Periplasm | IN Membrane |
| 12. Cyanelle | IN Cytoplasm | 37. Peroxisome | IN Cytoplasm |
| 13. Cytoplasm | Cytoplasm | 38. Plasmodesma | SURFACE Membrane |
| 14. Cytoskeleton | IN Cytoplasm | 39. Plastid | IN Cytoplasm |
| 15. Endoplasmic reticulum | IN Cytoplasm | 40. Podosome | SURFACE Membrane |
| 16. Endosome | IN Cytoplasm | 41. Proteasome | IN Cytoplasm |
| 17. ERMES complex | IN Cytoplasm | 42. Ribosome | IN Cytoplasm |
| 18. Extracellular | Extracellular | 43. Sarcomere | IN Cytoplasm |
| 19. Extracellular matrix | IN Extracellular | 44. Sarcoplasmic reticulum | IN Cytoplasm |
| 20. Focal adhesion | UNDER Membrane | 45. Spectrin cytoskeleton | UNDER Membrane |
| 21. Gap Junction | ACROSS Membrane | 46. Synapse | ACROSS Membrane |
| 22. Glycosome | IN Cytoplasm | 47. Vacuole | IN Cytoplasm |
| 23. Golgi | IN Cytoplasm | 48. Vesicle | IN Cytoplasm |
| 24. Inner membrane | IN Membrane | 49. Vesicular exosome | IN Extracellular |
| 25. Intermediate filaments | IN Cytoplasm | 50. Virion | IN Extracellular |
Advanced options: what if a protein localizes to multiple locations?
Many proteins have been experimentally observed at more than one location and carry mutliple localization annotations in Uniprot and/or GO. Examples include proteins that shuttle between organelles, that perform different functions at different points in development or cell differentiation, or that behave differently depending on cell type.
Cellwhere now includes an advanced feature to display duplicate copies of a protein node at alternative locations. The feature can be observed by running the default query but selecting “Annotation frequency” under localization options. Duplicate nodes are connected to their parent node by a green edge labelled with a question mark.
This feature is switched on by default when using "annotation frequency" but off by default when using priority flavors. It can be modified under advanced options at the bottom of the front page. By default, when the feature is selected, an alternative location will be shown if it has a frequency score >0.33 (i.e. if >33% of the protein's Uniprot/GO annotations map to this CellWhere localization). The user can set this cut-off value as desired, but low values will be refused if they result in a too large and over-populated graph. If using the feature with a priority flavor rather than annotation frequency, the score should be adjusted accordingly (e.g. to 7000 or some other high value).
How does CellWhere produce it's graphical display?
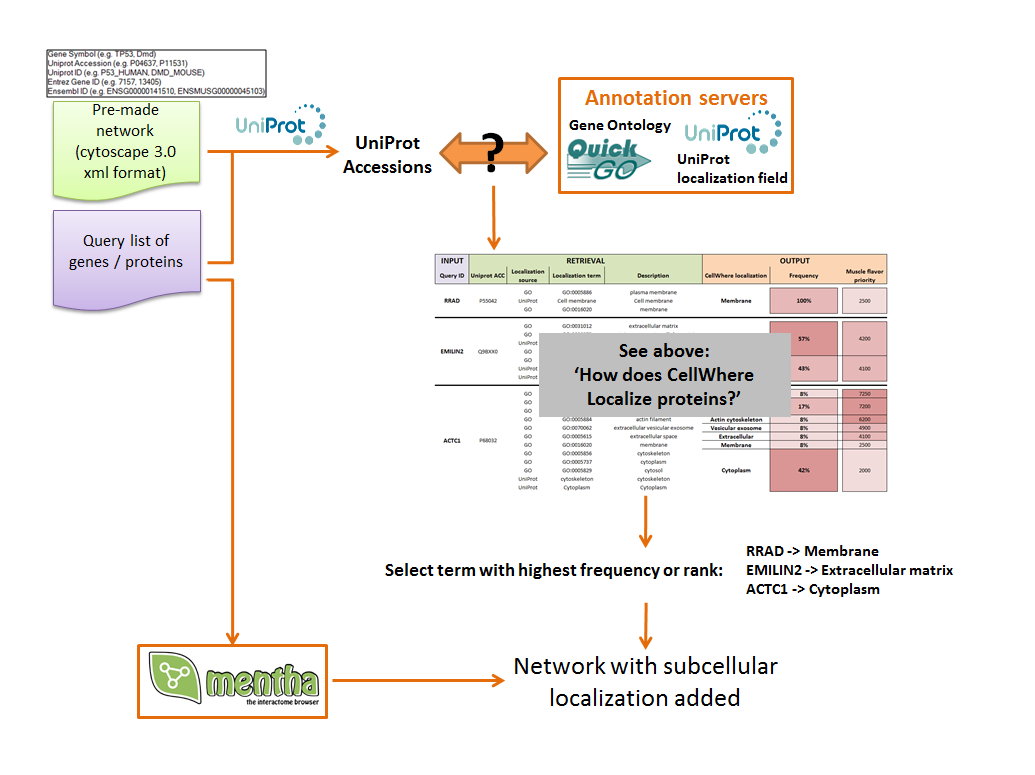
The localization step described above is used to visually organize the graph, as indicated in the two schema to the right below
CellWhere first attributes subcellular locations, as described above, for either the uploaded gene list or an uploaded pre-made network.
CellWhere will also query the Mentha server to retrieve known interactions between query proteins, together with the score allocated by Mentha as a measure of the strength of the evidence supporting each interaction.
If the option to grow the network using Mentha is selected, then CellWhere will request additional interactors of the query proteins. It will rank these by their score and retain all of the interacting proteins up to the maximum number set by the user.
[MOUSE-OVER TO ZOOM]
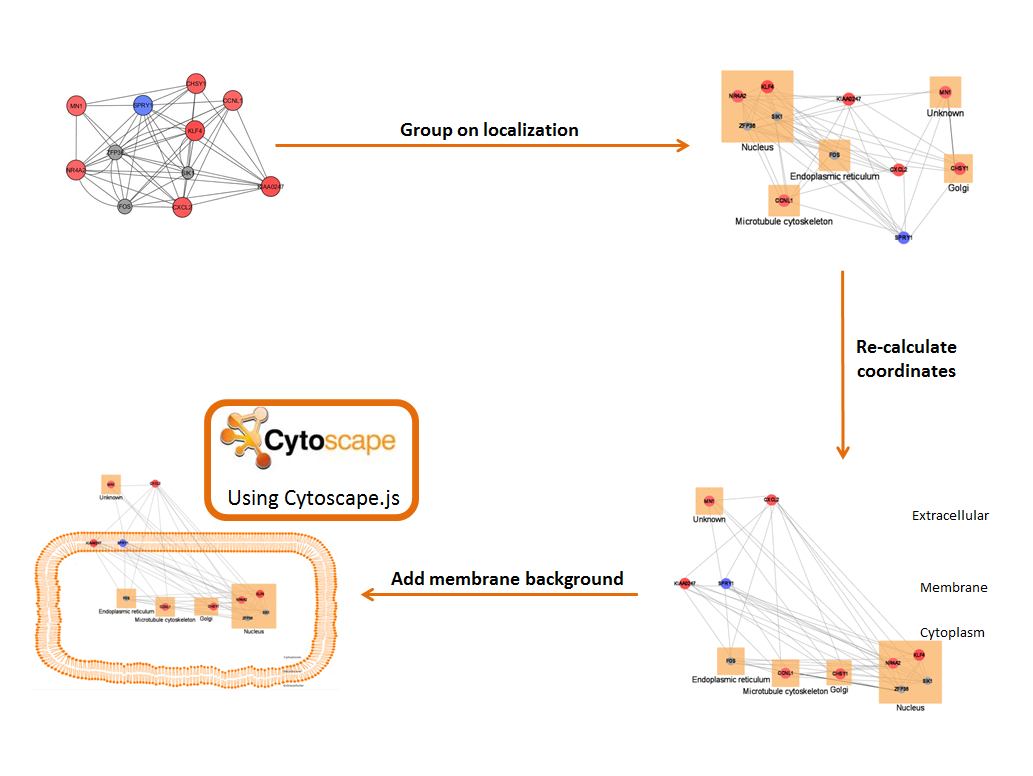
The resulting network, with subcellular locations added is then organized for visualization.
Proteins are grouped according to their location, and locations are organized graphically.
A limited vocabulary (as described above) specified in the mapping file tells CellWhere where to place each location relative to the cell and to the cell membrane (for example, the Gap Junction may be marked 'ACROSS Membrane', or the Peroxisome marked 'IN Cytoplasm').
Co-ordinates are recalculated and the network is displayed using Cytoscape.js, on top of a membrane background.
[MOUSE-OVER TO ZOOM]
What features does the graph have?
(this is also summarised in the 'GRAPH GUIDE' panel on the right side of the output page)
- • Left-clicking on a protein (a 'node') opens a link to it's UniProt page
- • Left-clicking on an interaction (an 'edge') pops up a box giving information from Mentha about its interaction evidence
- • Edge thickness is proportional to the strength of the supporting evidence
- • Hold left-click and drag to move nodes and localizations around
- • Hold right-click and swipe with the mouse to delete nodes and localizations
- • Query nodes are highlighted in red, except if a pre-made network is uploaded, and one of its attributes (e.g. fold-change) is selected to superimpose on the nodes (which would then be shaded red or blue, representing up- or down-regulation, respectively)
How can I find out about the evidence for an interaction?
As explained above, left-clicking on an interaction (an 'edge') pops up a box giving the evidence score and listing interaction evidence from Mentha. Edges with strong evidence scores have thicker widths. Evidence scores range from 0.03 (weakest) to 1 (strongest), and average around 0.25. Only ~10% of scores are stronger than 0.5. Details of the Mentha scoring function are given here.
The example table below shows the evidence for the interaction between Dystrophin (DMD gene) and Dystroglycan (DAG1 gene).
Mentha has provided four pieces of evidence for this interaction, two by crystallography, one by affinity chromatography and the other using pull down. A link is provided to the PubMed entry of the work in which the experiment was performed, and the source database is shown from which Mentha obtained the interaction evidence, together with the DOI of the supporting publication.
| Interaction type | Experimental method | PubMed | Source database | DOI |
|---|---|---|---|---|
| MI:0915(physical association) | MI:0004(affinity chromatography technology) | 7592992 | psi-mi:"MI:0463"(biogrid) BIOGRID:616598 | null |
| MI:0915(physical association) | MI:0096(pull down) | 19109891 | psi-mi:"MI:0469"(IntAct) intact:EBI-2134070 | 10.1016/j.cell.2008.10.018 |
| MI:0914(association) | MI:0114(x-ray crystallography) | 10932245 | psi-mi:"MI:0463"(biogrid) BIOGRID:278892 | 10.1038/77923 |
| MI:0407(direct interaction) | MI:0114(x-ray crystallography) | 10932245 | psi-mi:"MI:0469"(IntAct) intact:EBI-6673681 | 10.1038/77923 |
Advanced options: what are promiscuous interactors?
Certain proteins (for example, Ubiquitins and heat shock proteins) form a great many interactions due to general functions that are unlikely to be pertinent to a specific mechanistic pathway. CellWhere provides a feature to ignore 'promiscuous interactors' during the addition of binding partners from Mentha. CellWhere pre-processes the Mentha data, making interaction counts for every protein, and storing these in the CellWhere database. The default behavior is to ignore proteins that bind more than 100 partners. Mentha currently reports interactions for ~82,000 proteins, and ~1,300 (~1.5%) of these have more than 100 reported binding partners. The user may adjust the cut-off as desired – it is available under “advanced options” at the bottom of the front page.
How do I share the output?
Various sharing options are given in the 'SAVE AS...' panel on the right side of the output page
The output can be saved simply as html (if you want to email it, then we recommended to use the 'zipped' option as this will avoid problems with some email applications that will otherwise try to read the attached html)
The network can also be downloaded in Cytoscape 3's xgmml format, for example if you wish to manipulate the network using the Cytoscape 3 desktop application. Please note however that the localization groupings (known as 'compound nodes' in Cytoscape.js) cannot currently be displayed by Cytoscape 3.
Why is my favorite protein at a weird location?
Please see "Why is CellWhere wrong?".
What are the different download files and how can I use them?
Localization frequencies
You can now download all of CellWhere's default annotations frequencies. These
are available from the menu under downloads. They include 3 tables listing the most
frequently annotated localization for each protein,
based on CellWhere mappings of either Uniprot, GO, or both:
1. Localization frequencies: Uniprot and GO
2. Localization frequencies: Uniprot only
3. Localization frequencies: GO only
These files contain, for each protein, all of the CellWhere localizations - these are the results of
mapping GO and Uniprot annotations to CellWhere localizations. They also list a frequency score
for each localization. For example, Uniprot/GO localizations for the protein below, Q9ZT82,
were mapped to 4 CellWhere localizations (Membrane, Unknown, Golgi, and Plasmodesma). 57% of
Q9ZT82's Uniprot/GO localizations mapped to 'Membrane', and just 14% to each of the other three
CellWhere localizations:
Q9ZT82 Membrane 0.57
Q9ZT82 Unknown 0.14
Q9ZT82 Golgi 0.14
Q9ZT82 Plasmodesma 0.14
Flavors
You may also download existing CellWhere flavors (for an explanation of flavors, see
How does CellWhere localize proteins?
). These are already selectable in box 4 under "Screening by flavor", but they can be useful to
download to use as a starting point if you want to create your own flavor.
Is there a CellWhere API? Can I connect with CellWhere programmatically?
Yes! Please see "Developer guide for CellWhere".
If you have a question not covered here, or indeed if you are just curious about how CellWhere
works and whether we can tweak it to work better for you, please contact us at: